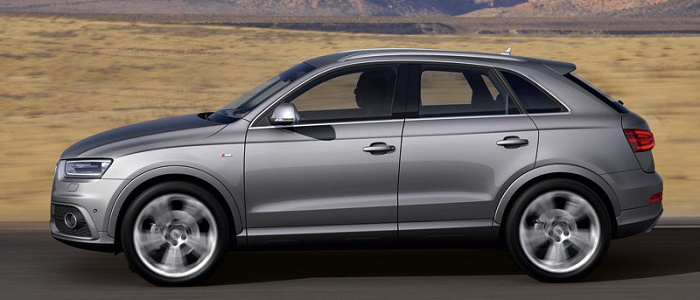
Audi Q3 2.0 TFSI Quattro
Model Year 2011 (Audi 8U), J - Segment (SUV)

drivers'

3.0

rating

Badges:
suv
suv
x 5
x 5
4 x 4
4 x 4
2.0 L4 16v
Turbo
Turbo
Petrol
Petrol

Basic info on Audi Q3 2.0 TFSI Quattro

The German car was first shown in year 2011 and powered by a 4 - cylinder turbo petrol unit, produced by Volkswagen. The engine offers a displacement of 2.0 litre matched to a 4 x 4 wheel drive system and a manual gearbox with 6 or a automatic gearbox with 7 gears. Vehicle in question is a suv with the top speed of 212km/h, reaching the 100km/h (62mph) mark in 8.2s and consuming around 7.4 liters of fuel every 100 kilometers.

Data

Engine info ( issues & breakdowns )
Volkswagen

2.0 TFSI BPJ

displacement:
1984
cc
configuration:
4 - Inline
 
valves:
16, 4 p/ cylinder
 
aspiration:
Turbo
 
fuel type:
Petrol
 
power:
170
hp
torque:
280
Nm
Vehicle information - Audi Q3
94% score
produced:
2011. - 2015.
 
body style:
suv
5 door
length:
4385
mm
width:
1831
mm
height:
1590
mm
boot:
460 - 1365
l
fuel tank:
64
l

Marketing

Performance

Manual gearbox performance

emission

E

category

manual gearbox

6 gears

average

7.4

l/100km

weight:
1485
kg
acc. 0-100 km/h:
8.2
s
top speed:
212
km/h
cons. (urban):
9.5
l/100km
cons. (highway):
6.1
l/100km
cons. (average):
7.4
l/100km
CO2 emissions:
174
g/km
Automatic gearbox performance

emission

E

category

automatic

7 gears

average

7.7

l/100km

weight:
1530
kg
acc. 0-100 km/h:
7.8
s
top speed:
212
km/h
cons. (urban):
10.2
l/100km
cons. (highway):
6.4
l/100km
cons. (average):
7.7
l/100km
CO2 emissions:
179
g/km

Pros & Cons compared to direct rivals

safety
reliability
comfort
practicality
performance
economy
boot space

Safety results for Audi Q3

EuroNCAP: 94% occupant safety

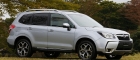
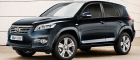
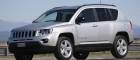
Other cars that might interest you...

produced from 2009. to 2012.  
EuroNCAP: not tested

acceleration

15%

slower

consumption

10%

higher

power

13%

lower

length

2%

longer

weight

6%

lower

fuel tank

5%

smaller

boot

10%

smaller

boot ext.

1%

smaller

price

95%

lower

produced from 2013. to 2015.  
EuroNCAP: 91% score

acceleration

23%

slower

consumption

7%

lower

power

13%

lower

length

5%

longer

weight

2%

lower

fuel tank

7%

smaller

boot

9%

larger

boot ext.

14%

larger

price

34%

lower

produced from 2010. to 2013.  
EuroNCAP: ~70% score

acceleration

22%

slower

consumption

3%

higher

power

8%

lower

length

=

equal

weight

2%

lower

fuel tank

7%

smaller

boot

22%

larger

boot ext.

22%

larger

price

37%

lower

produced from 2011. to 2016.  
EuroNCAP: 87% score

acceleration

1%

slower

consumption

13%

higher

power

6%

higher

length

1%

longer

weight

4%

higher

fuel tank

=

equal

boot

2%

larger

boot ext.

10%

larger

price

32%

lower

produced from 2011. to 2013.  
EuroNCAP: 61% score

acceleration

23%

slower

consumption

3%

higher

power

9%

lower

length

1%

longer

weight

6%

lower

fuel tank

25%

smaller

boot

40%

smaller

boot ext.

8%

smaller

price

40%

lower

Check a car by its VIN number

Visitor comments


NOTE: Fields marked with an asterisk (*) are mandatory. By sending a comment you confirm that you have read and agreed to our terms & conditions.

No comments at this time. Be the first one to write a comment.

Ok, this is cool, now what

Follow us

AutoManiac Instagram

AutoManiac Facebook

AutoManiac database currently covers:

47worldwide automotive brands
1.531different vehicle models
2.233engines
13.778specific cars